Summer officially began last weekend, but last week's spot market volume surged ahead of the calendar. Demand is hot and getting hotter.
After a brutal winter drove rates to record highs, the freight environment started to normalize in April, as rates slipped. They rose again in late May, however. Halfway through June, rates rocketed way up, and we may be entering uncharted territory.
The national average rate for vans is back above $2.05 per mile, and it seems to be trending up. The $2.10 average rate for March is still an all-time record, and if rates come any closer to that number in June, we can’t blame the weather. It’s the market.
Manufacturing is up. Construction is up. Produce season is well underway, and pressure is building in most agricultural markets with the possible exception of drought-stricken Central California. (Even there, harvests are only 3% behind last year's numbers, and rates remain high due to CARB as well as normal, seasonal constraints on reefer capacity.)
This surge in demand is facing off against tight capacity. Fleets costs are high, and productivity has been eroded by new HOS rules, so carriers are reluctant to add more trucks. Plus, it's getting harder to find enough experienced drivers to fill the seats of existing trucks.
We seem to be approaching a tipping point. Produce season is always a busy time, and this one is complicated by the threat of a port strike on the West Coast -- as union contracts there expire on June 30. Retailers are bringing in some freight early, for the back-to-school and holiday retail seasons, adding to the pressure on capacity and rates.
Tipping point or not, demand, capacity and rates can change from week to week, even in those same lanes you’ve been running for years. We can help you to prepare your customers – or your own sales force – for the changing environment, as you improve the outcome of your spot market rate negotiations.
DAT RateView gives you an amazing level of detail on rates and trends, so you can find the sweet spot, optimize your freight choices, and make more money – sometimes a lot more – without adding assets or staff. To contact our award-winning support team for a guided tour, fill out this
form or call (800) 551-8847.
 |
|
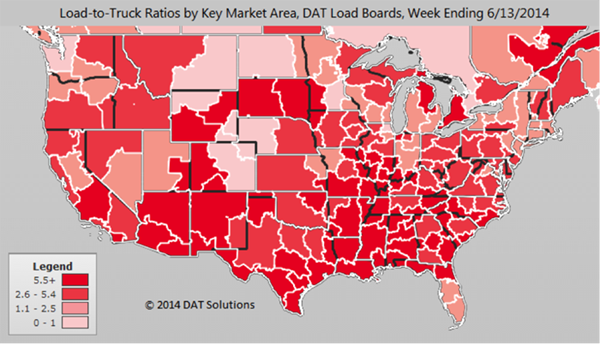
Truckload freight availability exceeds capacity throughout most of the U.S., as depicted in the Hot Market Map, above, for the week ending June 13. Outbound vans are in highest demand in Houston,TX and Jacksonville, FL, and a round-trip between those two markets was paying an average of $2.00 per mile in the past seven days. Hot Market Maps are among the analysis tools available in DAT RateView and DAT Power Load Boards. |
Freightliner’s Team Run Smart is partnering with DAT to offer a special on the TruckersEdge load board to its members. Sign up for TruckersEdge today and get your first 30 days free by signing up at www.truckersedge.net/promo717 or entering “promo717” during sign up.
*This offer is available to new TruckersEdge subscribers only
About TruckersEdge®, powered by DAT®
TruckersEdge® Load Board is part of the trusted DAT® Load Board Network. DAT offers more than 68 million live loads and trucks per year. Tens of thousands of loads per day are found first or exclusively on the DAT Network through TruckersEdge.